Volta comes with the free circuit simulator Ngspice out of the box. Ngspice is an open-source successor of UC Berkeley's widely-known SPICE 3 simulator. For more information on Ngspice please visit the Ngspice web site. For information on SPICE itself please visit the Wikipedia page.
You run simulations by pressing either the "Analyze" or the "Plot" button in the toolbar. "Plot" will capture the schematic (and replace the existing netlist) before starting the simulation. "Analyze" uses the existing netlist and does not capture.
The gear wheel icon of the Analyze button animates while the simulation is running. Pressing the button while it animates aborts the simulation.
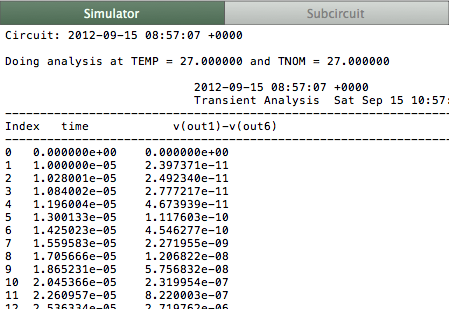
Volta displays the raw text output of the simulator in the "Simulator" panel.
When a simulation finishes, Volta automatically parses the output in order to extract analysis data. If tabular analysis data is present, Volta draws graphs in the plotter area.
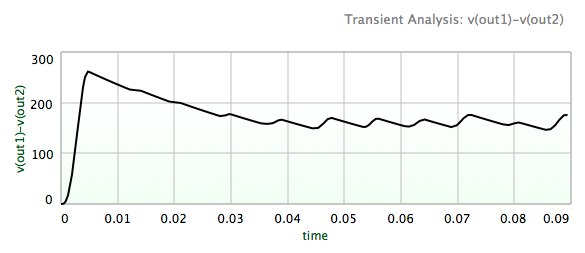
The plotter is still very basic. The ordinate (y axis) always shows real values in linear scale. The abscissa (x axis) shows real values in linear or logarithmic (for AC analyses) scale.
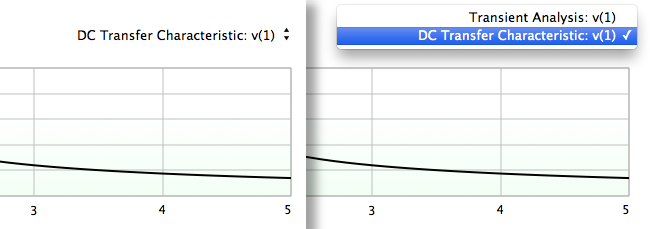
The plotter allows switching between multiple graphs through the menu seen in figure 3. The menu is only available if graph data for mulitple entities exist.